
Exploring Gene Activity on a Large Scale
Gene expression is one of the fundamental processes through which cells translate genetic information into biological functions. Although most cells within an organism share essentially the same genome, they can exhibit remarkably different characteristics because they express different sets of genes at different levels.
DNA microarray expression analysis provides a powerful approach to investigating these differences. By measuring the abundance of thousands of RNA transcripts simultaneously, this technology enables researchers to examine global patterns of gene activity across tissues, experimental conditions, developmental stages, and disease states.
From identifying molecular signatures to investigating cellular responses to environmental stimuli, DNA microarrays have contributed significantly to our understanding of complex biological systems.
1. What Is DNA Microarray Expression Analysis?
DNA microarray expression analysis is a high-throughput molecular technique designed to measure the relative expression levels of numerous genes within a biological sample.
The technology relies on a solid surface containing thousands of immobilized DNA probes. Each probe is designed to hybridize with a complementary nucleic acid sequence corresponding to a particular gene or transcript.
When fluorescently labelled sample-derived nucleic acids are introduced onto the microarray, complementary sequences bind to their corresponding probes. The resulting fluorescence signals are measured using a specialized scanner and processed to estimate gene expression levels.
Unlike conventional approaches that investigate individual genes separately, microarray technology allows researchers to examine large collections of transcripts within a single experiment.
This makes it particularly valuable for comparative gene expression studies, molecular classification, and the investigation of biological pathways.

2. The Scientific Principle Behind Microarray Technology
The fundamental principle of DNA microarray expression analysis is nucleic acid hybridization.
Hybridization occurs when complementary nucleotide sequences associate through specific base pairing. The strength and specificity of this interaction depend on factors such as sequence complementarity, temperature, salt concentration, and experimental conditions.
In a typical gene expression experiment, RNA is extracted from biological samples and converted into complementary DNA or complementary RNA, depending on the platform and labelling protocol. The labelled material is then applied to the microarray.
After hybridization and washing, a scanner measures the fluorescence associated with individual probes. Stronger signals generally indicate greater amounts of the corresponding target sequence, although background noise, probe characteristics, and technical variability must be considered.
The resulting measurements form a large expression matrix in which rows represent genes or probes and columns represent biological samples.
This matrix becomes the foundation for downstream statistical analysis and biological interpretation.
3. How Does a DNA Microarray Experiment Work?

Step 1: Biological Sample Collection
Researchers begin by collecting appropriate biological material, such as cultured cells, tissue specimens, or other samples relevant to the research question.
Experimental design is critical at this stage. Control and treatment groups should be clearly defined, biological replicates should be included, and potential confounding variables should be minimized.
Step 2: RNA Extraction and Quality Assessment
Total RNA is isolated from the samples using an appropriate extraction method. RNA quality and quantity are then assessed before proceeding.
Degraded RNA, contamination, or inconsistent sample preparation can compromise the reliability of expression measurements.
Step 3: Target Preparation and Labelling
RNA is converted into labelled complementary nucleic acids using a platform-specific procedure.
Fluorescent dyes or other detection systems allow the microarray scanner to distinguish the hybridized material from the surrounding background.
Step 4: Hybridization
The labelled targets are incubated with the microarray under controlled conditions.
Target molecules bind to complementary probes distributed across the array. Hybridization conditions are optimized to promote specific interactions while limiting nonspecific binding.
Step 5: Washing and Signal Detection
Following hybridization, washing steps remove unbound or weakly bound material. The microarray is then scanned to measure the signal associated with each probe.
The intensity measurements provide an initial representation of gene activity across the samples.
Step 6: Data Processing and Normalization
Raw fluorescence measurements are processed to reduce background interference and correct technical variation.
Normalization methods help make expression measurements more comparable across arrays. Depending on the platform, researchers may use procedures such as robust multi-array average normalization or other appropriate approaches.
Step 7: Statistical Analysis and Biological Interpretation
Researchers identify genes showing significant expression differences between experimental groups.
Differential expression analysis, clustering, pathway enrichment, and molecular network analysis can reveal patterns associated with the biological condition under investigation.
Importantly, statistical significance should be evaluated alongside effect size, biological relevance, and appropriate correction for multiple testing.
4. Types of DNA Microarray Platforms
DNA microarray technology includes several platform designs, each developed for particular analytical purposes.
Expression microarrays
These arrays contain probes targeting known genes or transcripts. They are used to compare gene expression profiles across samples and identify differentially expressed genes.
Single-colour microarrays
Single-colour systems measure each sample independently using one detection channel. Expression profiles are compared after suitable preprocessing and normalization.
Two-colour microarrays
Two-colour systems compare two labelled samples on the same array, often using different fluorescent dyes. Relative signal intensities provide information about differences between the samples, although dye effects and other technical factors require careful control.
Custom microarrays
Custom-designed arrays contain probes selected for a specific research question, organism, gene collection, or biological pathway.
The most suitable platform depends on the study objectives, available resources, sample characteristics, and required level of transcript coverage.

6. Understanding Differential Gene Expression
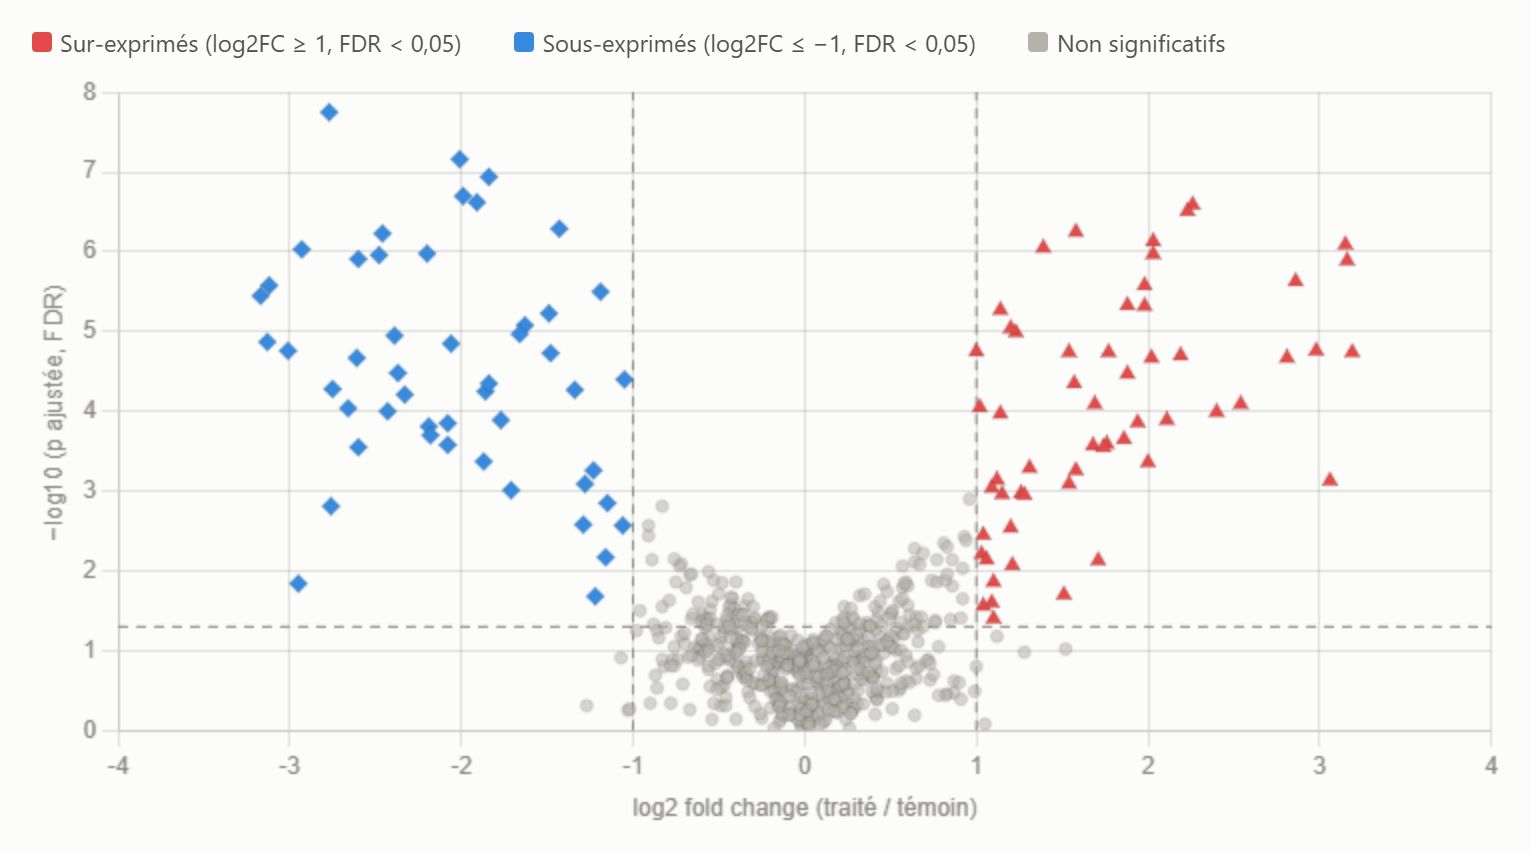
Differential expression analysis identifies genes whose measured expression levels differ between experimental groups.
For example, researchers may compare cells exposed to oxidative stress with untreated control cells. The resulting analysis can reveal genes that increase or decrease in expression under the experimental condition.
A common measure is the log2 fold change.
A log2 fold change of +1 corresponds to an approximately twofold increase in expression, whereas a value of −1 corresponds to an approximately twofold decrease, assuming the comparison and normalization are appropriately defined.
However, fold change alone is not sufficient to establish a reliable biological difference. Statistical testing, biological replication, data quality, and correction for multiple comparisons are also essential.
Because microarrays may evaluate thousands of genes simultaneously, controlling the false discovery rate helps limit the number of apparent findings attributable to chance.
7. Bioinformatics and Gene Expression Data Analysis
Modern microarray experiments generate large datasets that require computational processing.
Bioinformatics transforms raw signal measurements into interpretable biological information through several analytical stages.
Data preprocessing: Background correction, quality assessment, normalization, and filtering of unreliable probes.
Exploratory data analysis: Principal component analysis and sample clustering to investigate overall patterns, sample relationships, and possible batch effects.
Differential expression analysis: Statistical comparison of gene expression between defined groups.
Functional enrichment: Investigation of whether particular biological processes, molecular functions, or cellular components are overrepresented among the selected genes.
Pathway analysis: Examination of coordinated changes in signalling pathways, metabolic networks, and cellular response mechanisms.
Data visualization: Heatmaps, volcano plots, expression profiles, and clustering diagrams help researchers communicate complex findings.
Tools such as R and Bioconductor provide established resources for microarray preprocessing and statistical analysis. Appropriate software depends on the array platform, experimental design, and available annotation.
Biological interpretation should also account for probe specificity, outdated annotations, and the possibility that multiple probes correspond to the same gene.
8. DNA Microarrays Versus RNA Sequencing
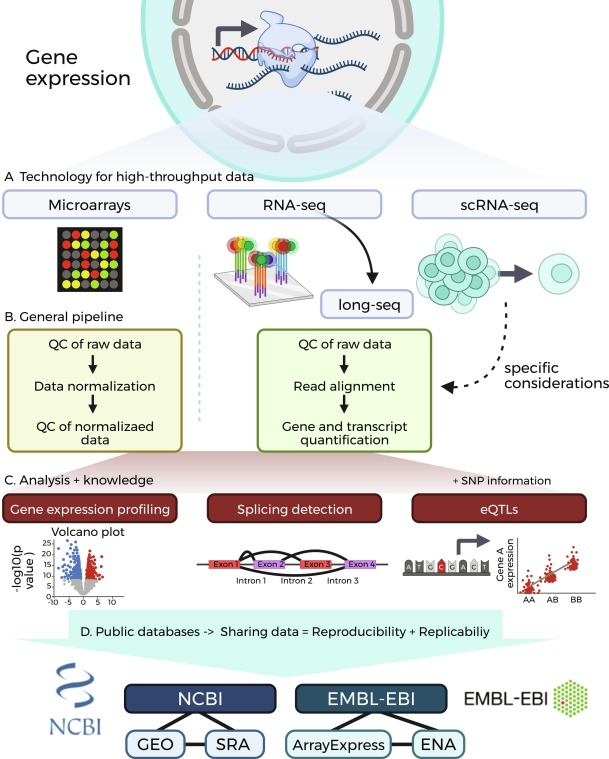
DNA microarrays and RNA sequencing are both used to investigate transcriptomes, but they differ in their underlying measurement principles.
DNA microarrays detect hybridization to predefined probes, whereas RNA sequencing identifies and quantifies transcripts through sequencing-based measurements.
Microarrays can be advantageous when studying well-characterized genes using an established platform. They can offer reproducible workflows and may be economical for certain large comparative studies, particularly when suitable datasets or infrastructure already exist.
RNA sequencing can detect a broader range of transcripts, including previously uncharacterized sequences, and may provide information about transcript isoforms and sequence variation depending on the experimental design.
However, RNA sequencing also requires careful consideration of library preparation, sequencing depth, computational resources, and analytical complexity.
Neither technology is universally superior in every situation. The appropriate method depends on the research objective, transcript coverage requirements, sample number, budget, and analytical resources.
9. Advantages and Limitations of DNA Microarray Technology
Major Advantages
Simultaneous analysis of thousands of genes.
Established experimental and analytical workflows.
Useful for comparative studies involving multiple biological conditions.
Efficient examination of predefined gene collections.
Compatibility with established expression datasets and historical studies.
Potential cost advantages for certain well-defined applications.
Important Limitations
Dependence on predefined probes limits the detection of unknown transcripts.
Cross-hybridization can produce signals from similar sequences.
Background noise and probe-specific effects may influence measurements.
Dynamic range may be more limited than that of some sequencing-based approaches.
Differences between array platforms can complicate direct comparisons.
RNA quality, sample preparation, and experimental design strongly influence data reliability.
Another important limitation is that transcript abundance does not necessarily correspond directly to protein abundance or biological activity. Additional experiments may therefore be needed to validate the functional significance of selected findings.
The Future of Gene Expression Profiling
Although sequencing-based approaches have expanded transcriptomic research, DNA microarrays remain relevant in specific settings, particularly when established probe collections, standardized workflows, or historical datasets are important.
Their continued value also depends on the ability to integrate expression measurements with other biological information.
Combining gene expression profiles with genomic variation, proteomic measurements, epigenetic data, and clinical characteristics can provide a more comprehensive view of biological systems.
Advanced statistical methods and machine learning may further support the classification of molecular profiles and the identification of complex expression patterns. However, robust validation, transparent analysis, and independent replication remain necessary to avoid overinterpreting computational predictions. The future of expression analysis will increasingly depend on selecting appropriate technologies and integrating complementary datasets rather than relying on a single measurement platform.